
GitHub Contributions Isometric 3D Graphs
Generate beautiful isometric contribution graphs with themes, caching and customization
Generate beautiful isometric contribution graphs with themes, caching and customization
GET /api/graph
Returns an SVG by default: it stays sharp at any size and is smaller
over the wire. Add format=png for a PNG.
| Parameter | Type | Required | Default | Description |
|---|---|---|---|---|
username |
string | Required | - | GitHub username |
year / y |
number|string | Optional | none (365 days) |
Year to fetch contributions for (e.g., 2025) or
none for 365-day rolling window ending today. Defaults
to 365-day history (supports year or y)
|
width |
number | Optional | 1000 | Image width in pixels |
height |
number | Optional | 600 | Image height in pixels |
stats |
boolean | Optional | false | Include statistics overlay (use stats=true) |
credit |
boolean | Optional | false | Show username credit (use credit=true) |
format |
string | Optional | svg |
Image format: svg or png. SVG stays
sharp at any display size and is smaller over the wire
|
theme |
string | Optional | github |
Visual theme: github, dark,
light, neon, minimal,
ocean, catppuccin, dracula,
crimson, tokyonight, sunset,
sakura, kanagawa, gruvbox,
rosepine, onedark, monokai,
matrix, synthwave,
halloween, solarized, or
custom (see the
URL and Theme Builder)
|
Build your graph URL with a live preview. Choose a preset theme, or pick Custom to design your own colors.
Pick Custom to design your own colors below.
Leave Year blank for a rolling 365-day window.
Preview different themes with the same data:
?theme=github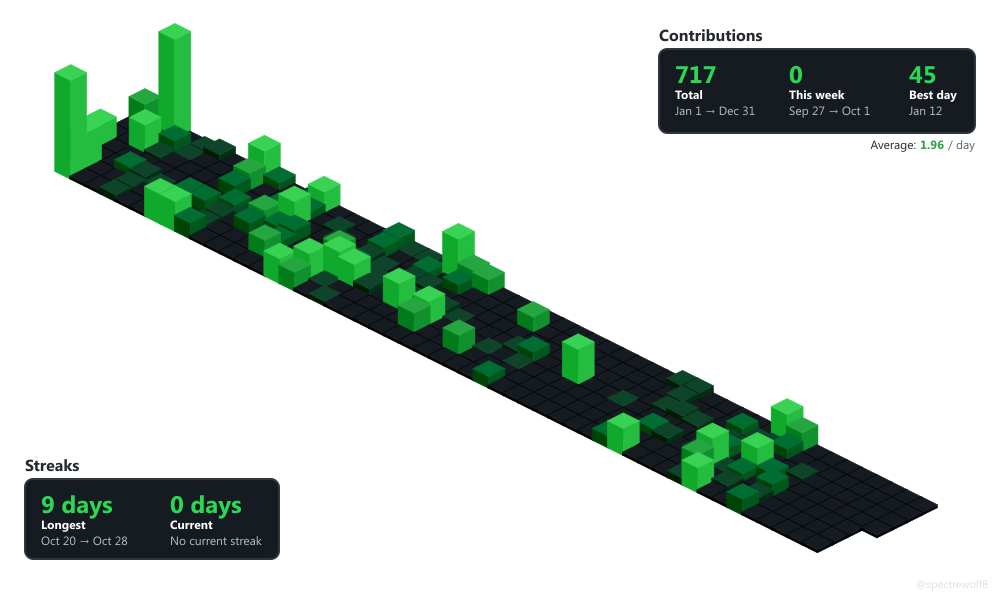
?theme=dark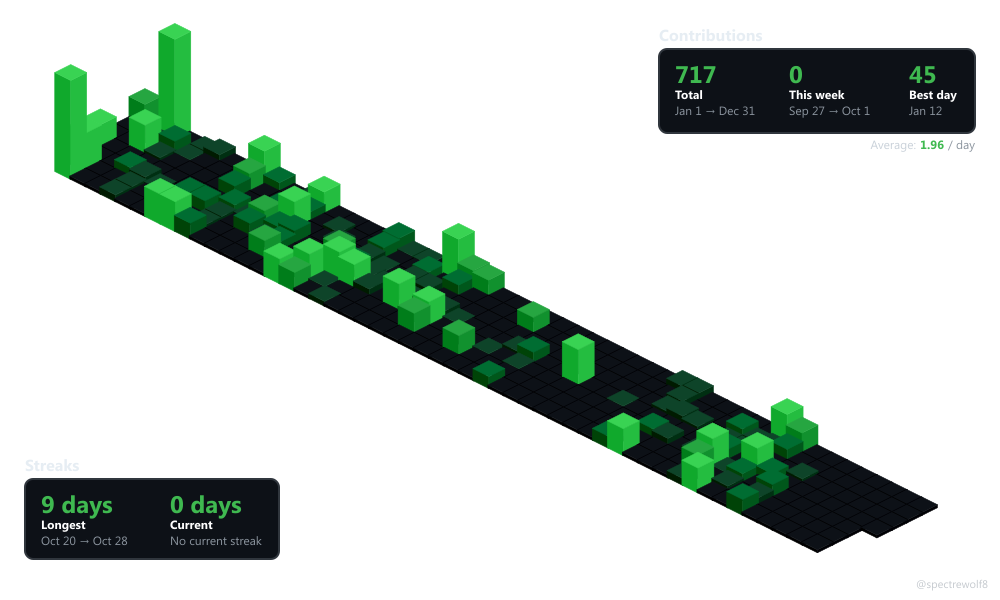
?theme=light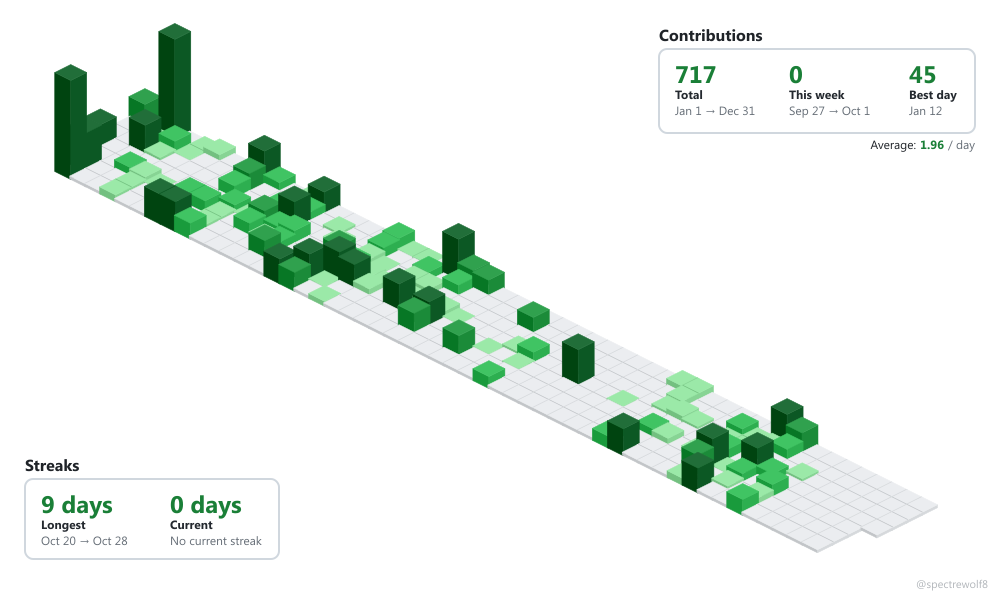
?theme=neon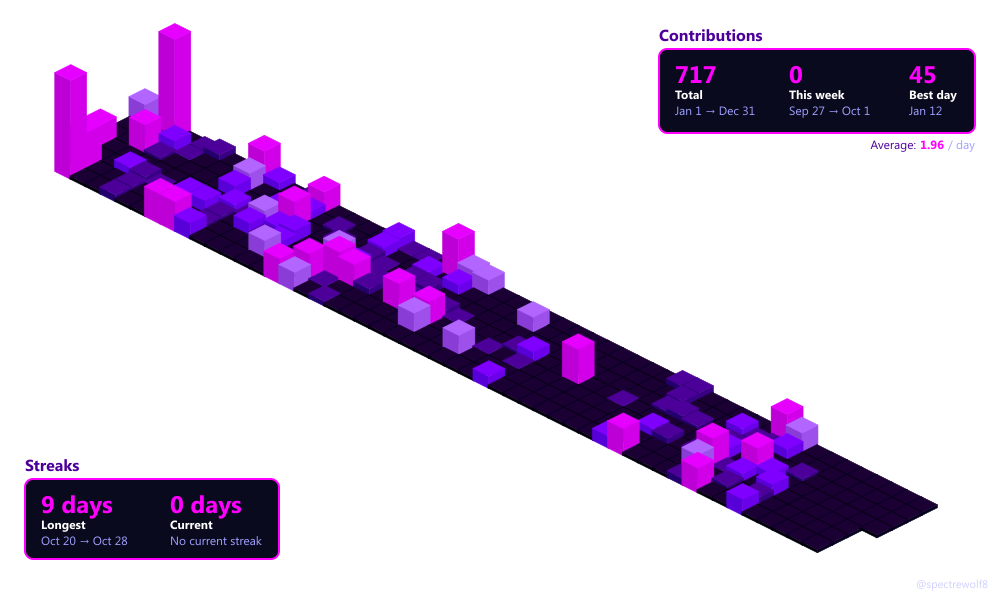
?theme=minimal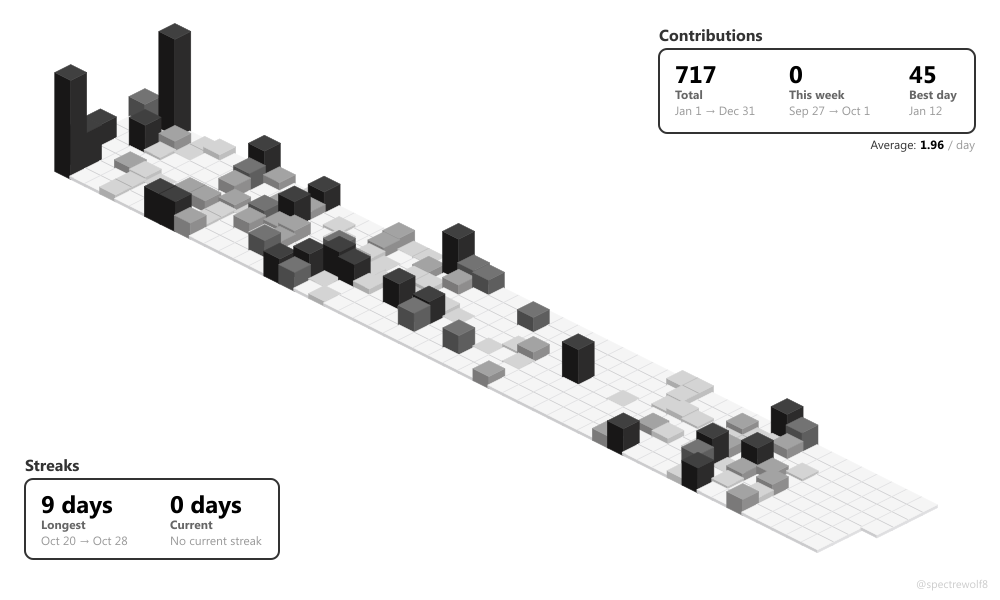
?theme=ocean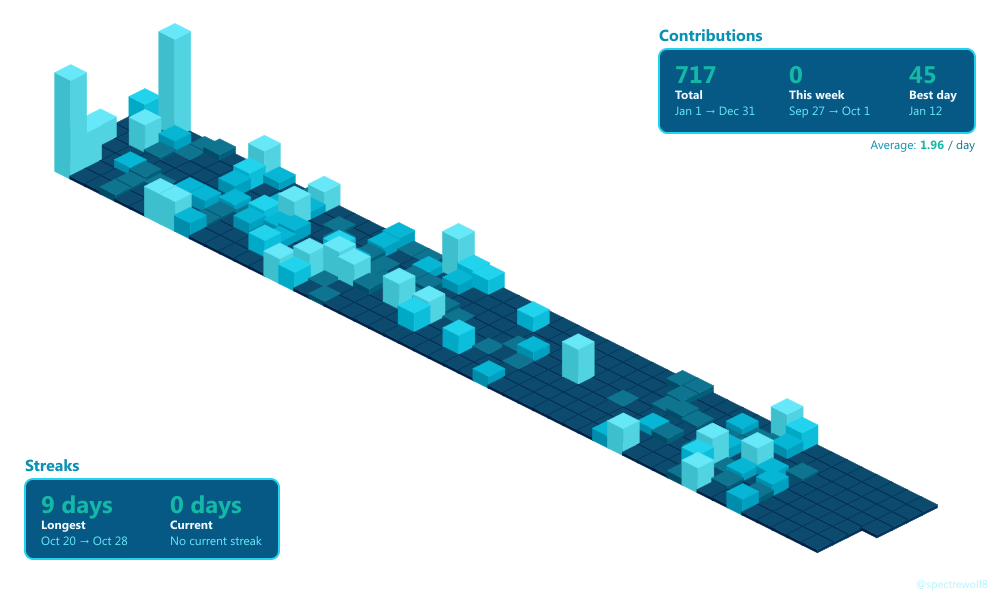
?theme=catppuccin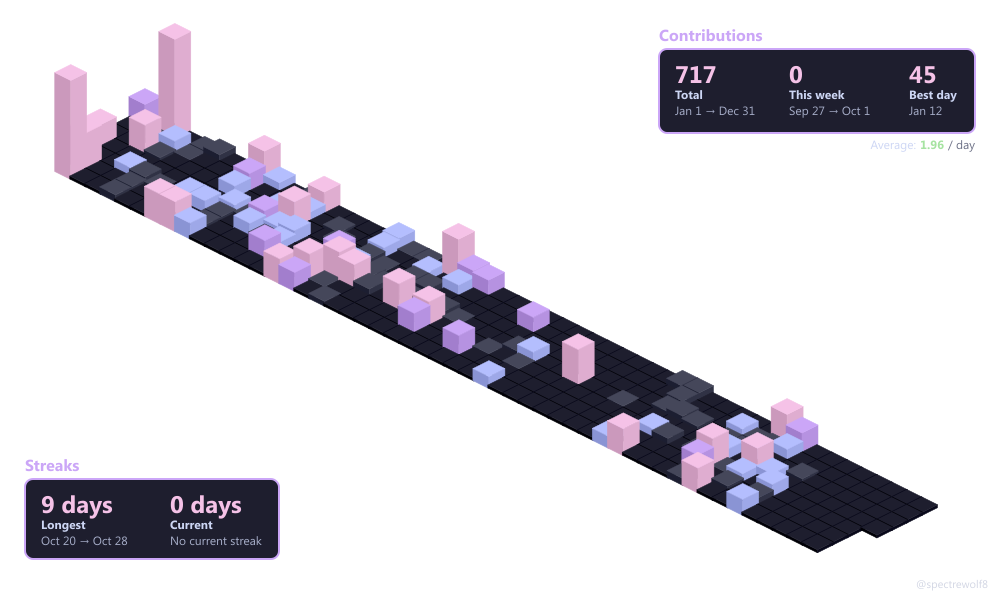
?theme=dracula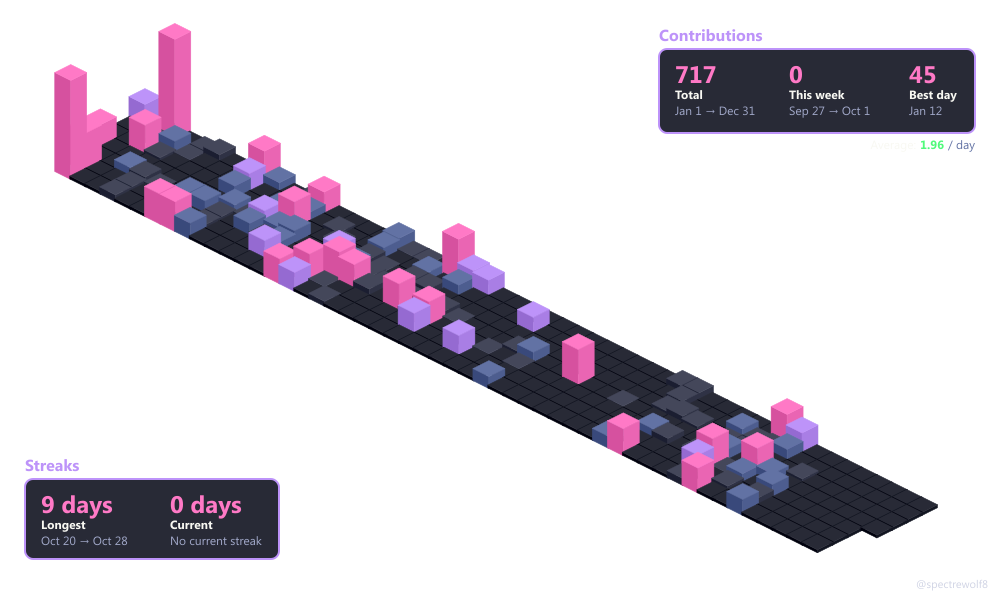
?theme=crimson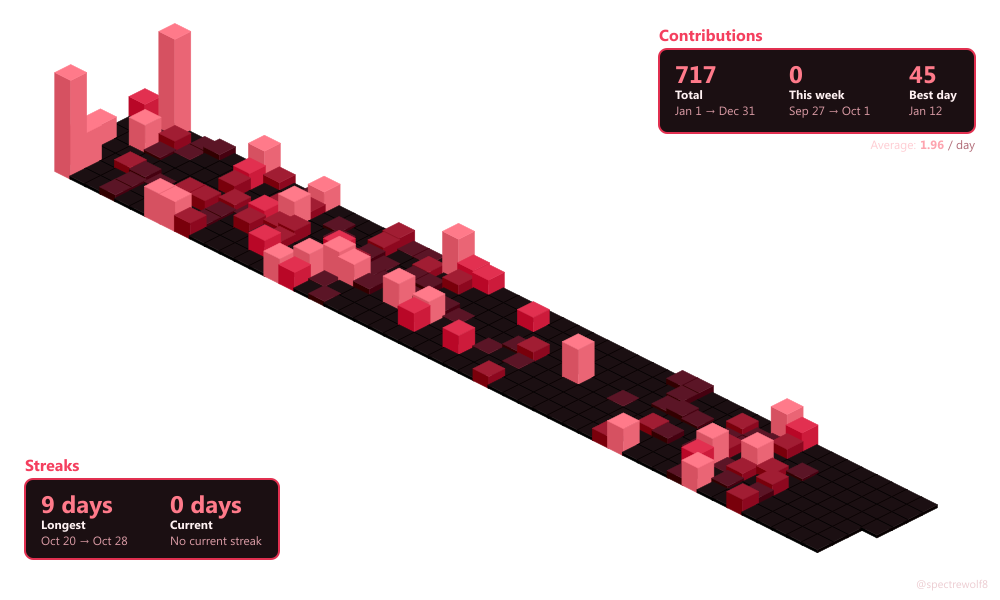
?theme=tokyonight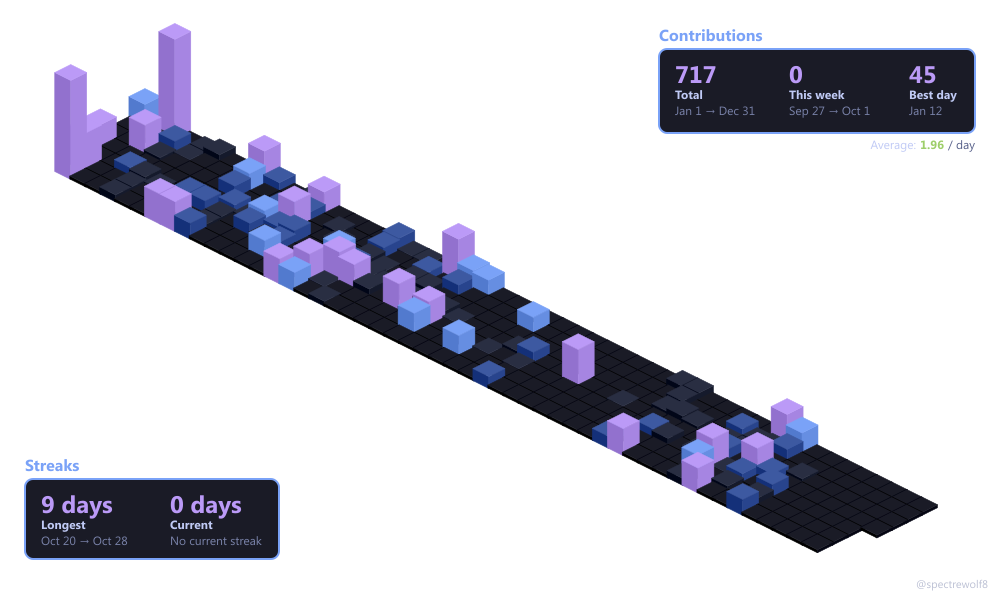
?theme=sunset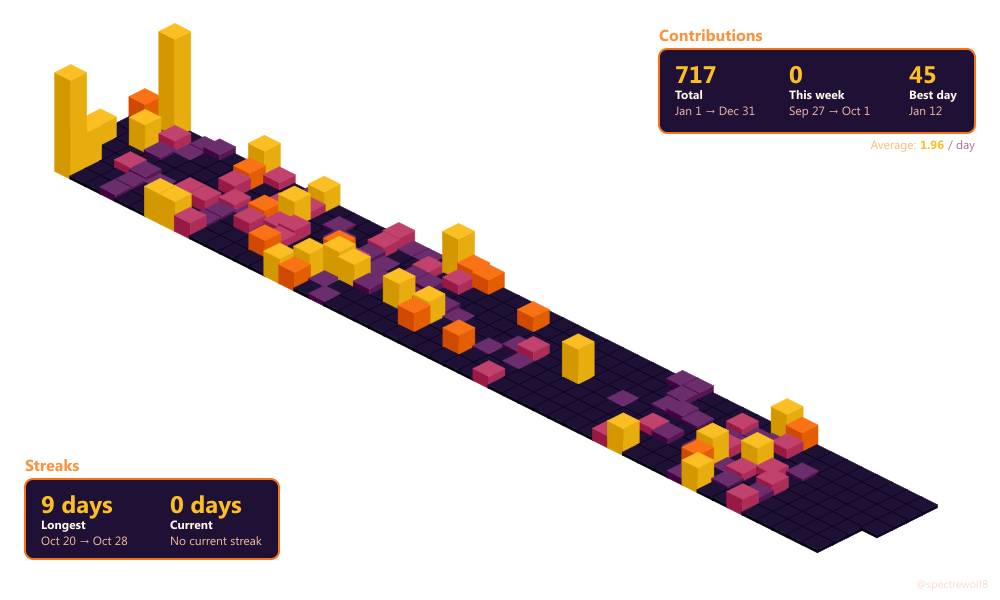
?theme=sakura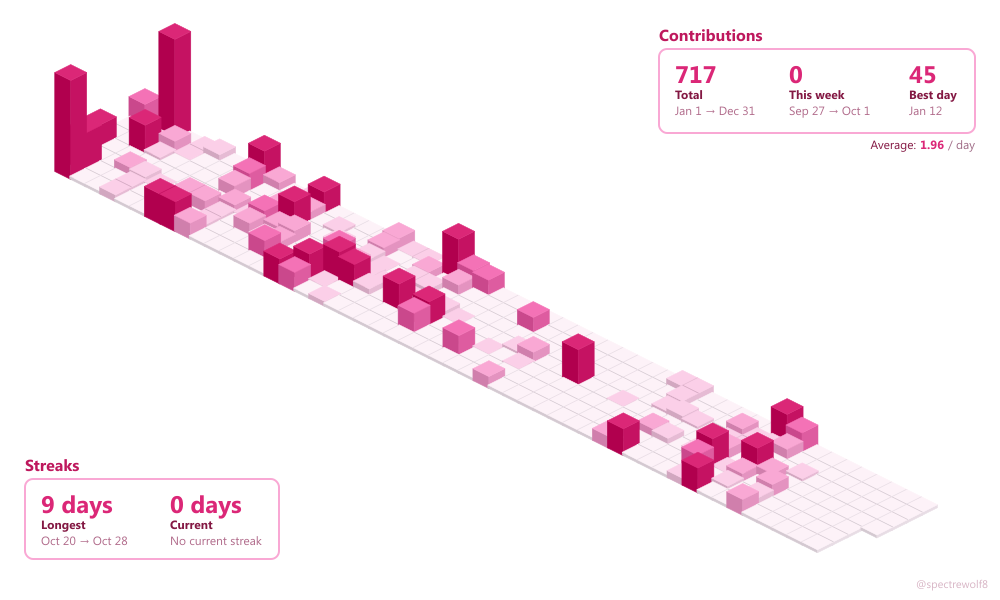
?theme=kanagawa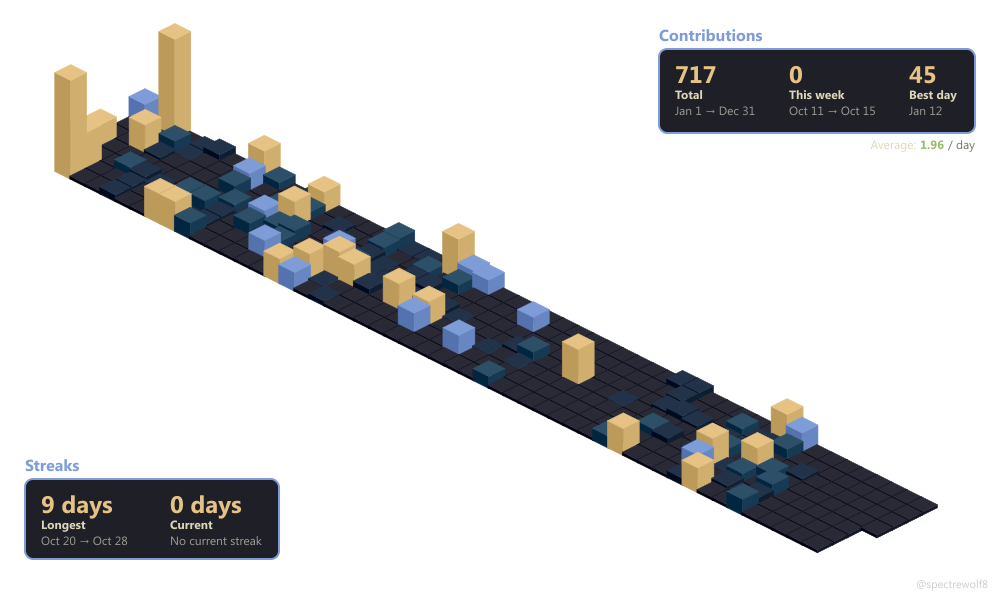
?theme=gruvbox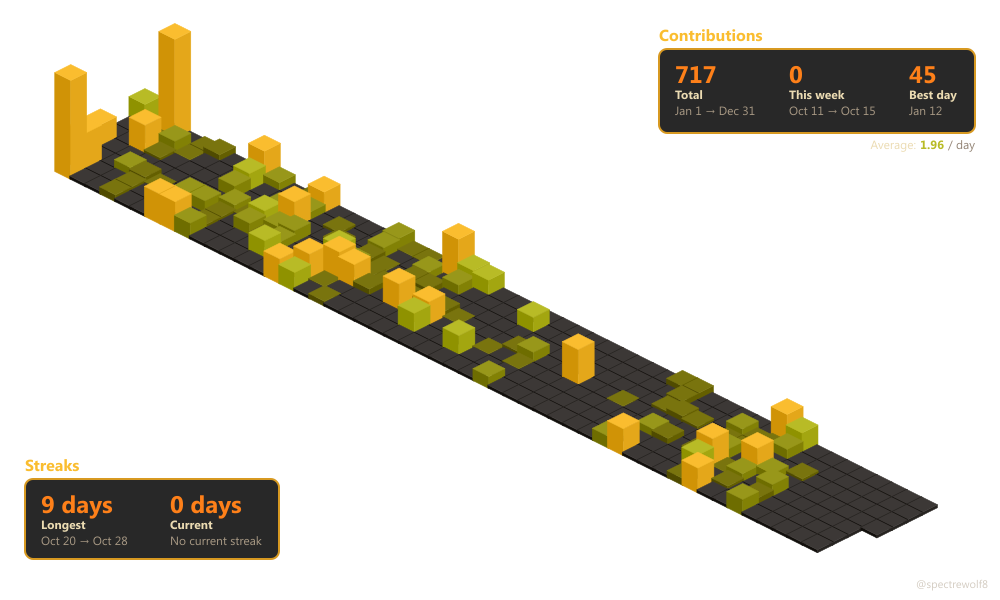
?theme=rosepine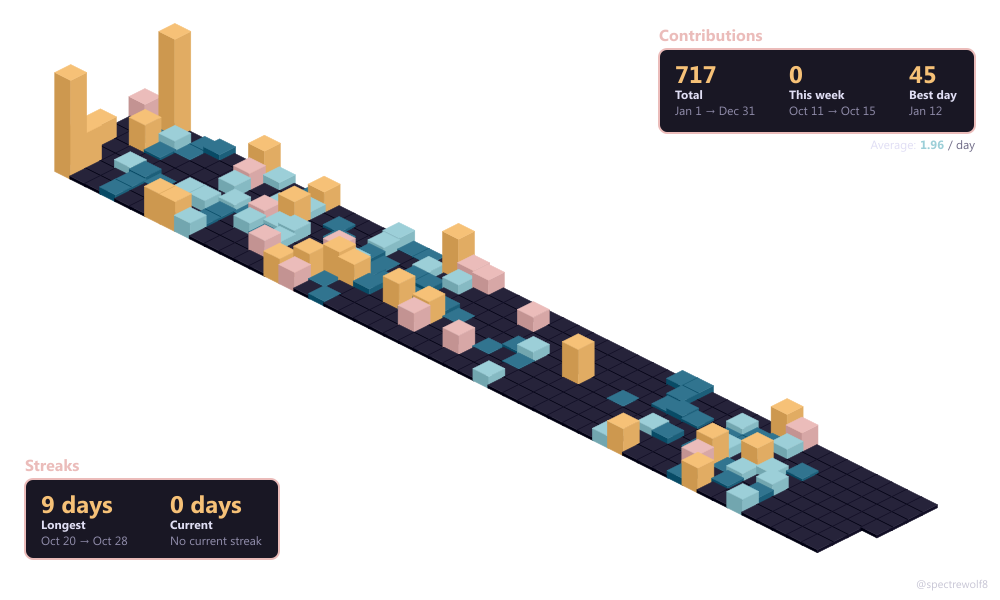
?theme=onedark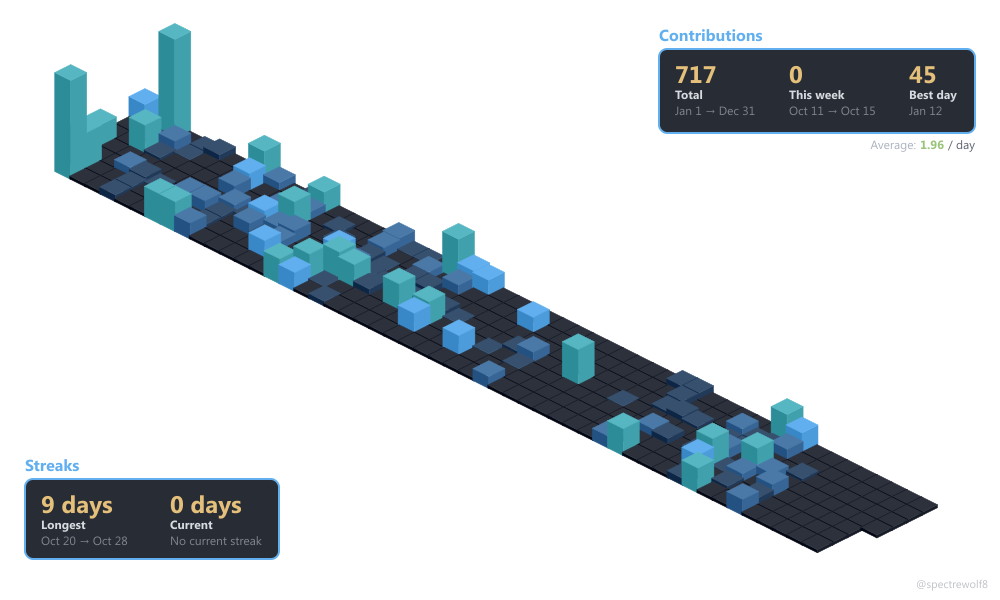
?theme=monokai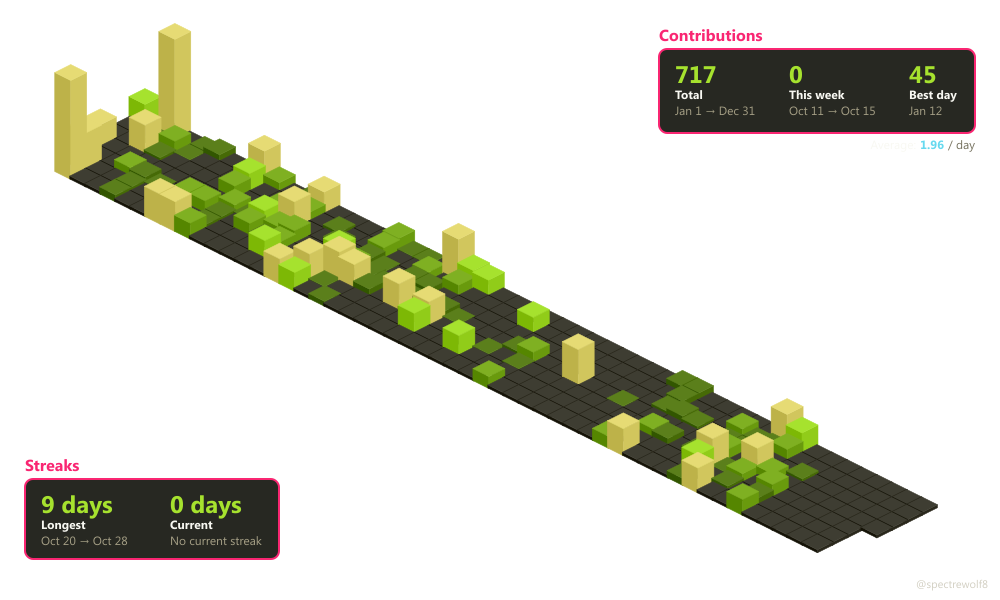
?theme=matrix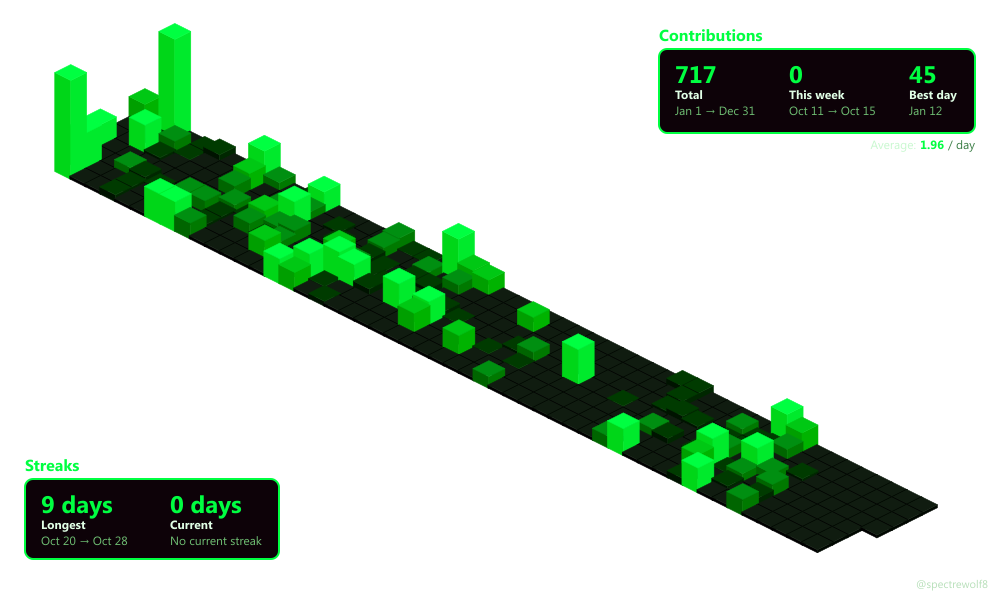
?theme=synthwave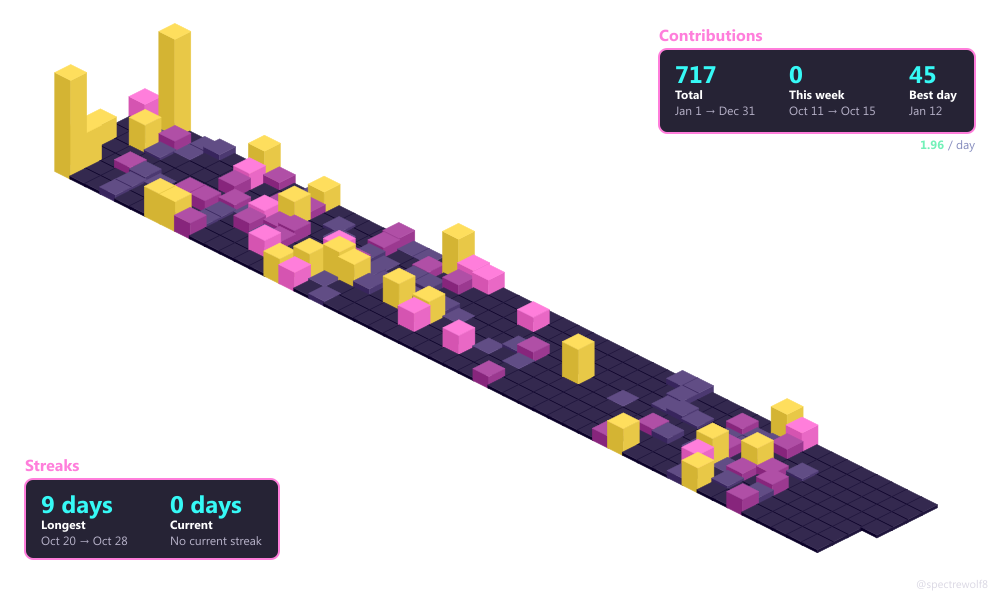
?theme=halloween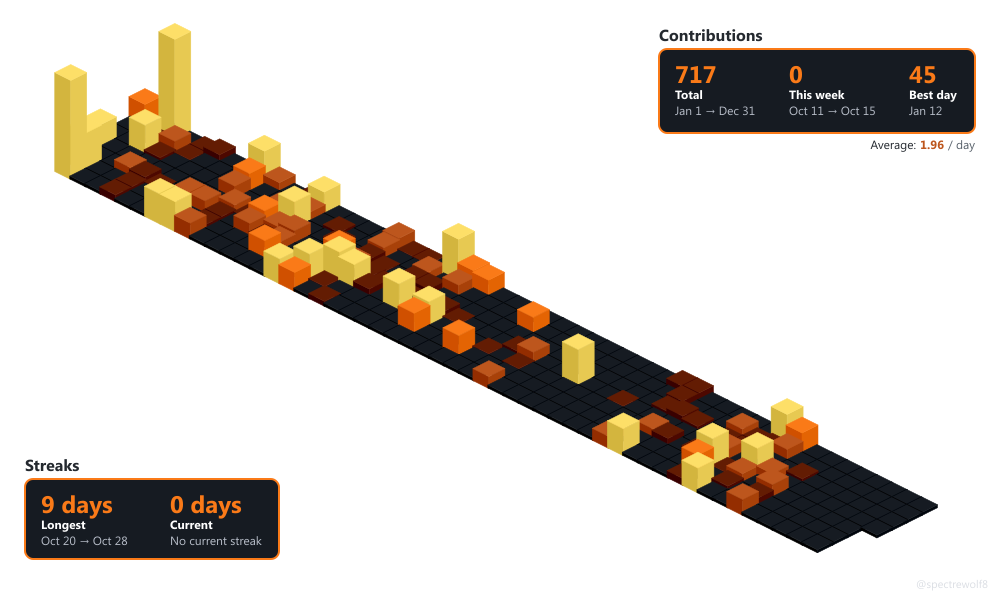
?theme=solarized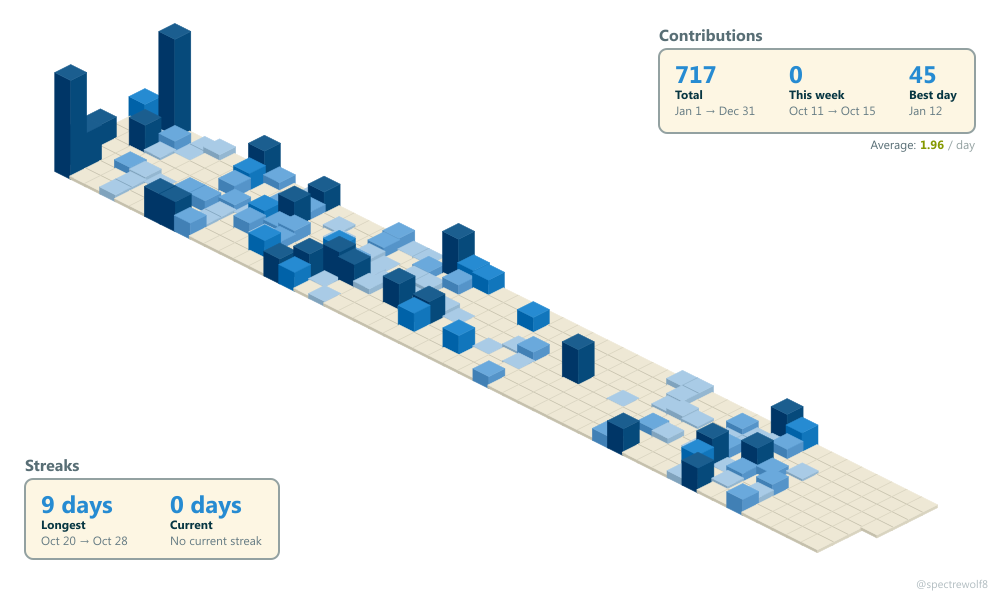
?year=none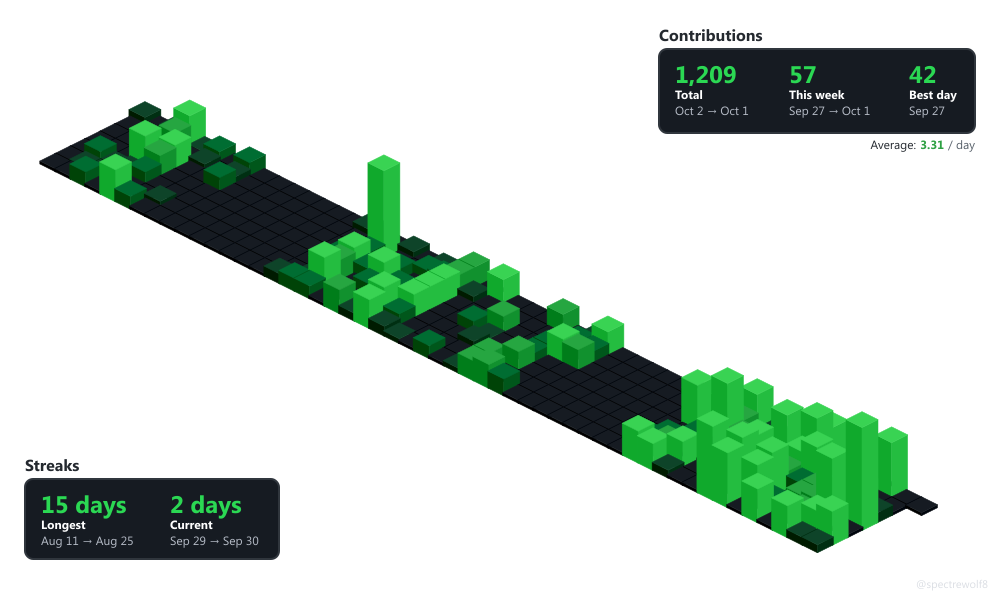
/api/graph?username=spectrewolf8
By default, shows the last 365 days of contributions ending today
/api/graph?username=spectrewolf8&year=2025
/api/graph?username=spectrewolf8&year=none
/api/graph?username=spectrewolf8&stats=true
/api/graph?username=spectrewolf8&width=1920&height=1080
/api/graph?username=spectrewolf8&theme=dark&stats=true
/api/graph?username=spectrewolf8&stats=true&format=png
/api/graph?username=spectrewolf8&year=2025&width=1200&height=700&stats=true&credit=true&theme=neon
Images are cached per username and parameters combination for 24 hours.
Multiple requests with the same parameters will be served from cache
instantly. Check the X-Cache header: HIT for
cached, MISS for newly generated.
Content-Type: image/svg+xml (gzipped when the client
accepts it), or image/png with format=png
Cache-Control: no-store, no-cache, must-revalidate, max-age=0
(images are never cached client-side, so README graphs are always
fresh; the 24-hour cache is server-side only)
X-Cache: HIT | MISS (cache status)Errors return JSON with an error message:
{
  "error": "Error message here"
}
Graphs are built from GitHub's official GraphQL API, and the total is the same number GitHub shows on your public profile ("N contributions in the last year").
Private contributions are included if you display them. GitHub's profile setting Contribution settings > Private contributions shows your private activity publicly, anonymized (green squares, no repo names). When it's on, those contributions are counted for every viewer, the graph included. When it's off, they're hidden from your public profile and from the graph alike. Either way, the graph matches what the public sees.
The one thing that makes the graph lower than your profile is an organization's token policy. An organization can restrict personal access tokens (for example, capping fine-grained token lifetimes). When it does, GitHub hides that organization's repositories, even public ones, from the service's token, and every contribution to them silently drops out of the graph. Nothing in the API flags this, so the service can't detect it; it can only tell you the possibility exists. If you run your own server, use a classic token, which isn't subject to these policies.
See exactly what's being counted for you over the last 365 days, and how much of it is private activity counted anonymously. If the total matches your profile, your graph is complete:
All-time usage statistics since launch:
Explore the project, report issues, or star it if you find it useful:
github.com/Spectrewolf8/GitHub-Contributions-Isometric-3D-Graphs-Embed